California’s commercial cannabis laws, as established through the Medicinal and Adult Use Cannabis Regulation and Safety Act (MAUCRSA), have always contained the acutely problematic provisions of so-called local control as well as the express exclusion of cannabis from the California Environmental Quality Act (CEQA) exemptions endowed to all other agricultural crops. This has created an unworkable dynamic for California’s legal cannabis mixed light and outdoor cultivators who are uniquely vulnerable to baseless claims of excessive water use. Such claims are routinely deployed as a trojan horse by those ideologically opposed to cannabis legalization in order to prevent the permitting of specific projects, as well as to obstruct the effectuation of necessary local ordinances.
In order to really understand the speciousness of these arguments, it is important to evaluate the water use of other agricultural activities in California. As a baseline fact, agricultural activities are the primary consumer of water resources in California, accounting for approximately 80% of all water used for businesses and homes in the state.[1] Since the scale of consumption is so vast, common units like gallons and liters don’t suffice to measure water use. Instead, agricultural water use is often measured in acre feet.
Agricultural activities account for approximately 80% of all water used by businesses and homes in the state of California.
An acre foot is the amount of water required to cover one acre of land up to one foot. This is equivalent to 43,560 cubic feet or 325,851 gallons of water; or roughly half an Olympic sized swimming pool.[2]
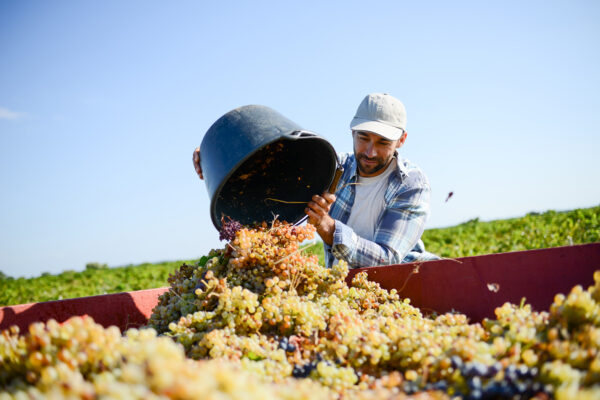
Cannabis cultivation, like almost all other agricultural activities, consumes water. However, cannabis actually uses a relatively small amount of California’s water when compared to the average water consumed to grow an acre of California’s other major agricultural crops.[3]
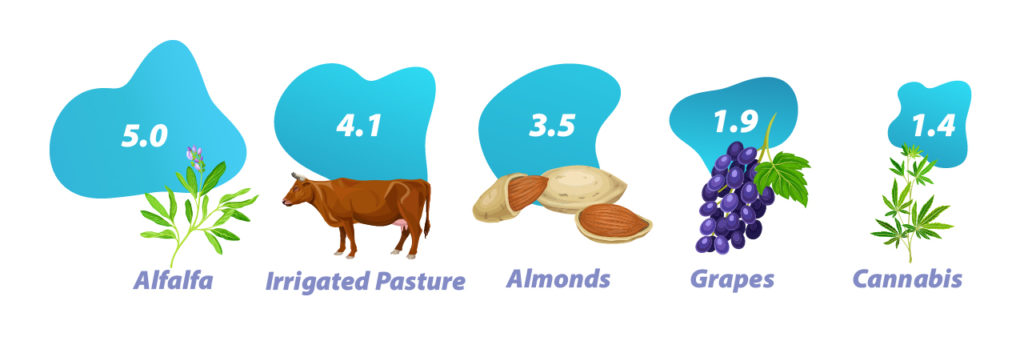
Average Acre Feet of Water Required to Cultivate One Acre of Various Crops
The Scale of Cannabis Cultivation
An examination of cannabis’ water usage doesn’t stop at scrutinizing the average acre feet of water required to cultivate an acre of cannabis and other important crops in California. To reveal the entire picture, we must look at the scale of cultivation of each crop.
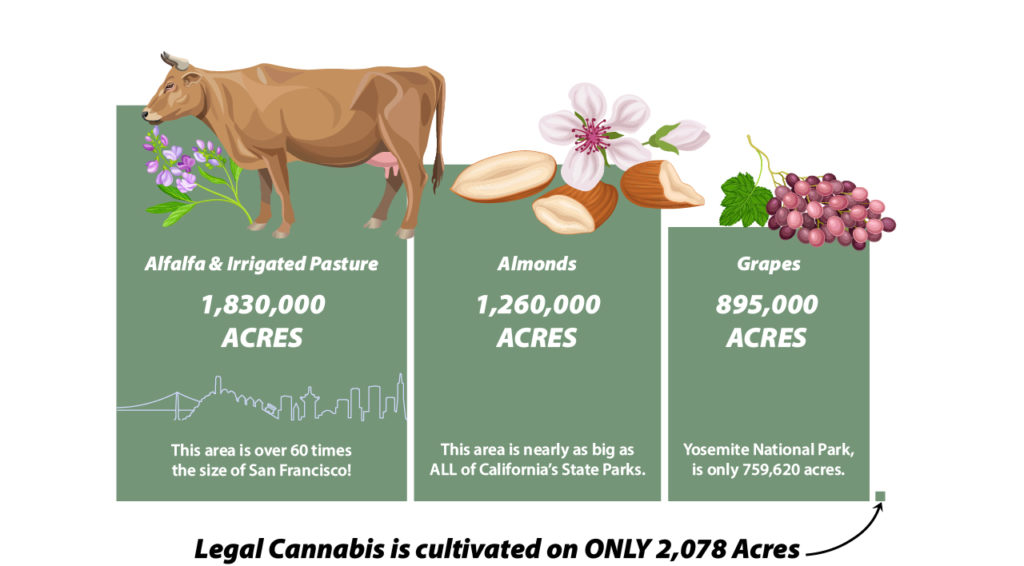
As of August 19, 2021, there were only 8,081 active cannabis cultivation licenses issued in California.[4] Assuming ALL 8,081 licensees are cultivating the maximum permissible area, which is a likely overestimation, we calculated a maximum cultivated area of 2,078 acres.[4] Even with this likely overestimation of cannabis farm canopy, this is still a paltry amount of acreage relative to other agricultural activities.
For reference, the assumed 2,078 acres of legal cannabis cultivation is approximately twice the size of Golden Gate Park in San Francisco or half the size of Griffith Park in Los Angeles.[5]
The maximum possible acreage (2,078 acres) of legal cannabis canopy in California is LESS than half the size of Griffith Park in Los Angeles.
Perhaps, the comparison to other crops is more illustrative. California cultivates approximately 1 million acres of alfalfa, which is predominantly used for livestock feed.[6] California also cultivates approximately 830,000 acres of irrigated pasture.[6] For perspective, this total area–1,830,000 acres–represents an area 60 times the size of the City of San Francisco. And this is just the land area used to grow alfalfa and irrigated pasture for livestock.[6]
California also devoted over 1,260,000 acres to almond cultivation in 2020.[7] This area is nearly as big as all of California’s state parks combined.[7] In 2020, Grapes were cultivated on 895,000 acres: an area that easily dwarfs Yosemite National Park.[8]
Again, California, even with the likely over estimation of plant canopy as described above, only has 2,078 acres of licensed cannabis canopy. This is 0.1% of the irrigated land used to grow alfalfa and pasture for livestock.
Total Land Under Cultivation Of Various Crops in California
The Water Used By California’s Cannabis Industry
California’s legal and regulated cannabis industry only uses a small amount of water relative to other agricultural activities. Based on our calculations, alfalfa and irrigated pasture cultivation in California uses about 8,403,000 acre feet of water. This is 16 times the entire water usage of Los Angeles.[9] Similarly, in 2020, almond cultivation, another huge consumer of California’s agricultural water, used about 4,914,000 acre feet of water. This is more than the volume of Lake Shasta (4,552,000 acre feet), California’s largest freshwater reservoir.[9] Assuming an average 1.4 acre feet of water required to grow an acre of cannabis (Figure 1), California’s legal cannabis canopy consumes approximately 2,909 acre feet of water or 0.03% of the water used by alfalfa and irrigated pasture.[9]
Total Water Consumed By Various Crops in California
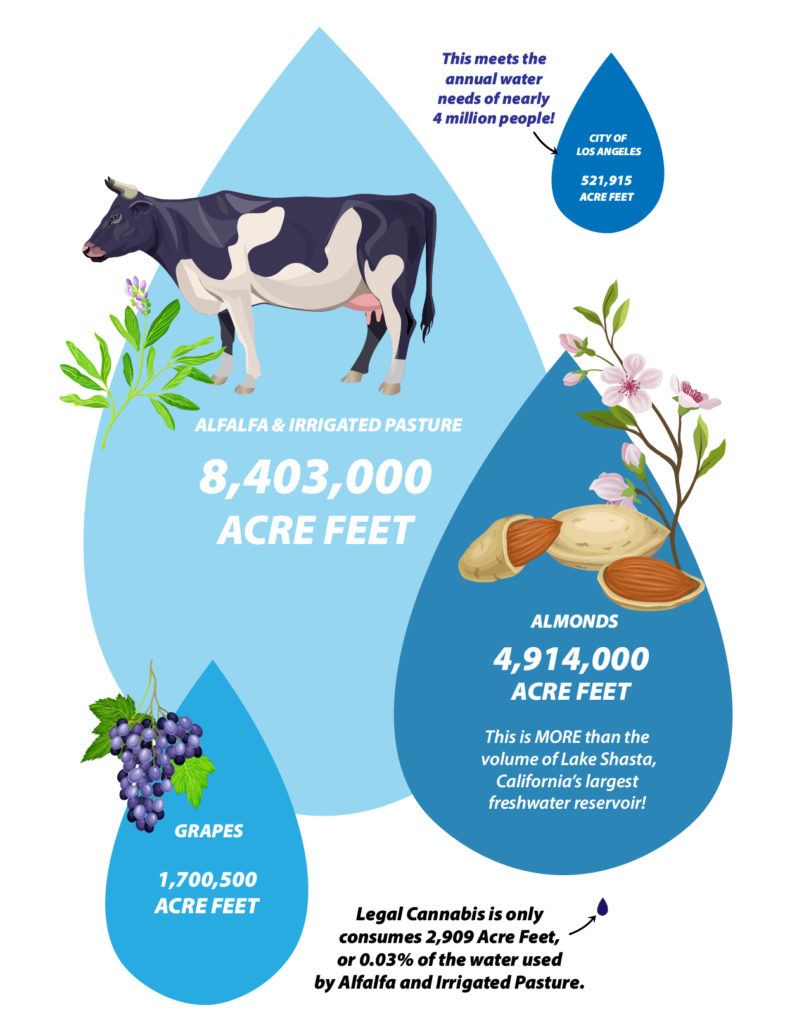
Figure 3: Annual water usage (in acre feet) of various crops as well as the City of Los Angeles, shown to scale.
Conclusion: California’s Legal Cannabis Farms Are Unfairly Scapegoated with Claims of Excessive Water Use Leading to Bad Policy
As one can see, California’s legal cannabis farms do not use a significant amount of the state’s water relative to other agricultural activities. Unfortunately, in cities and counties across the state, opponents of cannabis legalization deploy false claims of excessive water use by legal farms to justify draconian local policies which heavily burden, or outright prohibit, commercial cannabis cultivation. This is misguided; advocates of fair and equitable cannabis policies, as well as elected officials and regulators, should push back with the facts.
Unfortunately, in cities and counties across California, opponents of cannabis legalization deploy false claims of excessive water use by legal farms to justify draconian local policies which heavily burden, or outright prohibit, commercial cannabis cultivation.
Regulated Cannabis Cultivation Produces More Relative Value than Any Other Agricultural Activity.
As established above, California’s legal cannabis farms use relatively little water as compared to other agricultural activities. It is also true that the relative economic value of commercial cannabis as compared to other agricultural activities clearly places cannabis cultivation as the most valuable agricultural activity in California relative to water use.
In 2020 California’s cannabis industry paid over $1.1 billion in state taxes, including over $143 million in cultivation tax and over $571 million in cannabis excise tax.[10] This excise tax–15% of the average market value of cannabis and cannabis products at retail–allows us to estimate the value of cannabis and cannabis products created in 2020 by California’s legal cannabis industry at nearly $3.8 billion.
Table 1: 2020 Cannabis Industry Taxation Revenues in California[10]
For comparison, California’s most aggregately valuable agricultural commodity, milk and other dairy products, generated $7.34 billion in value in 2019.[11] Cattle and calves, the fourth highest valued agricultural commodity, were valued at $3.06 billion.[11] Together these two categories give us a combined valuation of $10.4 billion for livestock and related commodities. Almonds, the second most valuable agricultural commodity, were valued at $6.09 billion in 2019; and grapes were valued at $5.4 billion.[11] In other words the cannabis industry’s fiscal contribution to the state economy is a similar order of magnitude as most valuable agricultural commodities in the State.
Economic Value Generated by Various Crops In California
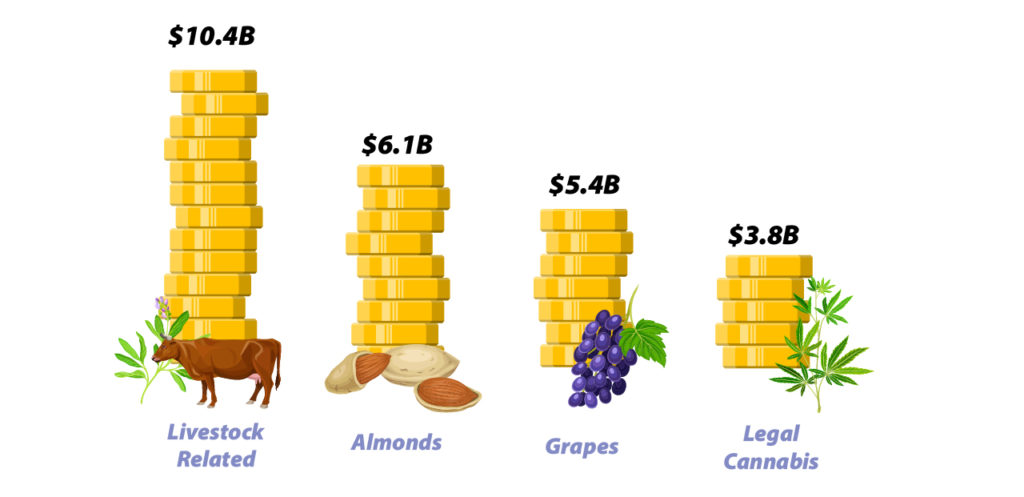
Figure 4: Economic value (USD) generated by various crops in California compared to the value of cannabis and cannabis products.
Note: The “Livestock Related” category includes milk, dairy products, cattle and calves. 2019 commodity values used for all crops except cannabis and cannabis products, which reflect 2020 figures.
The cannabis industry’s disproportionate contribution is even more obvious when you compare the economic value generated by the industry with the water resources used.
Economic Value Generated By Various Crops For Every Acre Foot of Water Consumed
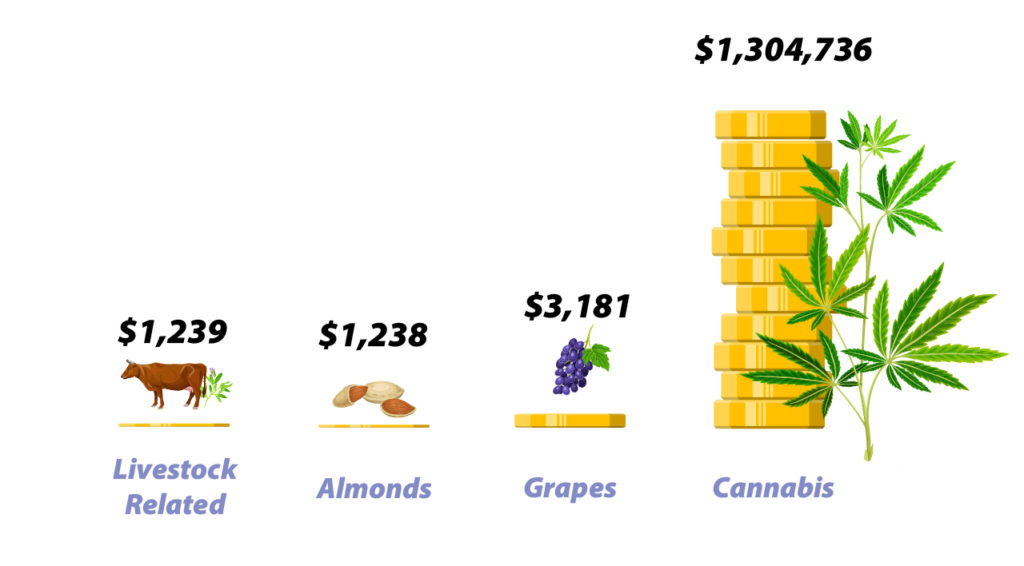
Figure 5: Economic value (USD) generated by various crops per acre foot of water consumed. Note: The “Livestock Related” category includes milk, dairy products, cattle and calves. 2019 commodity values used for all crops except cannabis and cannabis products, which reflect 2020 valuation.
As you can see, the economic value generated for every acre foot of water consumed in California places cannabis far ahead of all other agricultural uses in a manner which can only be described as grossly disproportionate. This is to say that there is no other crop which has demonstrated both such incredible value and water use efficiency in California as regulated commercial cannabis.
What We Can Do: Advocate for Evidence Based Cannabis Policy. If That Doesn’t Work, Change State Law.
The evidence discussed above is compelling and leads to the only reasonable conclusion that California’s cannabis policies must reflect the realities of the relatively minuscule impact on water use and high economic value relative to other crops. Unfortunately, many local jurisdictions, particularly in Northern California’s Emerald Triangle and North Coast, do not utilize this data in implementing local policies and instead capitulate to community elements dead set on stopping the implementation of MAUCRSA. This leads to unworkable local programs in places such as Mendocino County, Lake County, Trinity County, Sonoma County, Humboldt County, and other similarly situated municipalities. The net result of this is that commercial cannabis outdoor and mixed light cultivators are hamstrung in widespread local permitting morasses which prevents them from operating their businesses in a way that any reasonable person would expect to be able to operate a legal farming business.
California’s cannabis policies must reflect the realities of the relatively minuscule impact on water use and high economic value relative to other crops.
The call to action then becomes evident: local community members, advocates, regulators, and elected officials need to push through the smoke screen of CEQA and other false claims related to water use that are used to justify draconian local policies under the guise of so-called “local control” under Prop. 64. Instead, we need to enact responsible and data driven policies.
I invite you to review this information and share it with your network and local government officials. If, after having reviewed the data, local governments still refuse to implement rational cannabis permitting regimes, the question then becomes whether it is time to consider a clean-up initiative for the voters to reinforce their directive to truly legalize commercial cannabis throughout California by removing so-called local control and providing for equitable treatment under CEQA.
If you are interested in learning more and collaborating, please don’t hesitate to reach out. You can also download the information in this post as an infographic.
Footnotes
[1] Agriculture Consumes a Majority of California’s Non-Environmental Water
In California water is shared across three main sectors: environmental (~50%), agricultural (~40%), and 10% urban. More than nine million acres of farmland are irrigated in California. This represents roughly 80% of all water used for businesses and homes, i.e. non-environmental needs.
Relevant Sources:
- State of California. (2021). Agricultural water use efficiency. Department of Water Resources. https://water.ca.gov/Programs/Water-Use-And-Efficiency/Agricultural-Water-Use-Efficiency.
- Public Policy Institute of California. (2019). Water Use in California. PPIC Water Policy Center. https://www.ppic.org/publication/water-use-in-california/
[2] An Acre Foot Compared to the Volume of an Olympic-sized Swimming Pool
An Acre Foot is 0.49 times the volumes of an (official) Olympic-sized swimming pool.
| Volume (Cubic Feet) | Volume (U.S. Gallons) | |
| Acre Foot | 43,560 | 325,853.38 |
| Olympic Swimming Pool | 88,000 | 660,000.00 |
Relevant Source:
FINA (Fédération Internationale De Natation). (2021). (publication). FINA Facilities Rules. Facilities Rules 2017 – 2021. Lausanne, Switzerland. Retrieved from: https://resources.fina.org/fina/document/2021/01/19/c81a714a-022d-4622-ab8b-b22e95eb2be3/2017_2021_facilities_28012020_medium_ad.pdf.
[3] Average Acre Feet Required to Cultivate An Acre of Various Crops in California
Relevant Sources:
- Cooley, H. (2015). (rep.). California Agricultural Water Use: Key Background Information (pp. 3–4). Oakland, CA: Pacific Institute. Retrieved from https://pacinst.org/wp-content/uploads/2015/04/CA-Ag-Water-Use.pdf.
- Ingraham, C. (2019, April 26). Forget almonds: Look at how much WATER CALIFORNIA’S pot growers use. The Washington Post. https://www.washingtonpost.com/news/wonk/wp/2015/06/26/forget-almonds-look-at-how-much-water-californias-pot-growers-use/.
- Johnson, R., & Cody, B. A. (2015). (rep.). California Agricultural Production and Irrigated Water Use (p. 18). Washington, D.C.: Congressional Research Service. Retrieved from https://sgp.fas.org/crs/misc/R44093.pdf.
- Martin, A. (2018, February 14). Conservation is key for cannabis cultivators. Ceres Courier – Ceres Courier. https://www.cerescourier.com/news/local/conservation-is-key-for-cannabis-cultivators/.
- Pera, M. (2021, July 1). Which California crops use the Most water? Santa Rosa Press Democrat. https://www.pressdemocrat.com/article/specialsections/these-are-the-california-crops-that-use-the-most-water/.
[4] Cultivation Area (Canopy Size) of All Active California State Cannabis Cultivation Licenses
To calculate the total area devoted to cannabis cultivation in California we downloaded a list of all active, about to expire, and expired but pending renewal cultivation licenses from the Department of Cannabis Control’s public database. Based on state regulations, licensees are allowed to cultivate a maximum area based on the type of license. (See table below.)
| Cannabis Cultivation License | Maximum Permitted Canopy (Area) |
| Specialty Cottage Outdoor | Up to 25 mature plants. [2,500 sq ft]* |
| Specialty Cottage Indoor | 500 sq ft |
| Specialty Cottage Mixed-Light Tier 1 and 2 | 2,500 sq ft |
| Specialty Outdoor | 5,000 sq ft |
| Specialty Indoor | 5,000 sq ft |
| Specialty Mixed-Light Tier 1 and 2 | 5,000 sq ft |
| Small Outdoor | 10,000 sq ft |
| Small Indoor | 10,000 sq ft |
| Small Mixed-Light Tier 1 and 2 | 10,000 sq ft |
| Medium Outdoor | 1 acre (43,560 sq ft) |
| Medium Indoor | 22,000 sq ft |
| Medium Mixed-Light Tier 1 and 2 | 22,000 sq ft |
| Nursery | [21,780 sq ft]** |
| Processor | [0 sq ft]*** |
* The regulations don’t specify a cap for maximum area for Specialty Cottage Outdoor cultivation; instead they limit cultivation to 25 mature plants. Based on the area of Speciality Outdoor licenses which are capped at 50 mature plants or up to 5,000 square feet of canopy, we assumed 100 sq ft per mature plant and designated a maximum canopy size of 2,500 sq ft for Specialty Cottage Outdoor licenses.
** The regulations do not define a maximum canopy size for nursery licenses, as nurseries don’t grow plants to maturity. For the purposes of estimation, we are assumed a generous 1/2 acre (21,780) for each active nursery license.
*** Processor Licenses are for cultivators that only trim, cure, dry, grade, package or label cannabis. As such, we have assumed zero square feet for permitted canopy size for processor licenses.
Relevant Sources
- Rogoway Law Group. (2021). (publication). Active California Cannabis Cultivation Licenses as of August 19, 2021. Cannabis Compliance Team, Rogoway Law Group. San Francisco, CA; Retrieved from: https://docs.google.com/spreadsheets/d/1ByMq1R1CxI_LSMGh4JQkoSOs4L4a3OXLFkjuByuvQPU/edit#gid=376806201.
- State of California. (2021). License Search. Department of Cannabis Control (Accela Citizen Access). https://aca6.accela.com/CALCANNABIS/Cap/CapHome.aspx?module=Licenses.
- State of California. (2021). License Types – Cultivation Licenses. Department of Cannabis Control. https://cannabis.ca.gov/applicants/license-types/#cultivation-licenses.
[5] California’s Legal Cannabis Acreage compared to popular city parks in the State.
California’s Legal Cannabis Acreage, 2,078 acres, is 0.49 times the area of Griffith Park (4,217 Acres) in Los Angeles and 2.02 times the area of Golden Gate Park (1,027 Acres) in San Francisco.
| Griffith Park, Los Angeles | 4,217 Acres |
| California’s Legal Cannabis Canopy | 2,078 Acres |
| Golden Gate Park, San Francisco | 1,027 Acres |
Table 4: California’s Legal Cannabis Acreage compared to popular city parks in the State.
Relevant Sources:
- The Trust for Public Land. (2010). (publication). The 150 Largest City Parks. Center for City Park Excellence, The Trust for Public Land. San Francisco, CA. Retrieved from http://cloud.tpl.org/pubs/ccpe-largest-oldest-most-visited-parks-4-2011-update.pdf
- Rogoway Law Group. (2021). (publication). Active California Cannabis Cultivation Licenses as of August 19, 2021. Cannabis Compliance Team, Rogoway Law Group. San Francisco, CA; Retrieved from: https://docs.google.com/spreadsheets/d/1ByMq1R1CxI_LSMGh4JQkoSOs4L4a3OXLFkjuByuvQPU/edit#gid=376806201.
[6] Alfalfa and Irrigated Pasture Acreage
According to the University of California, “about 1,000,000 acres of alfalfa are irrigated in California. This large acreage coupled with a long growing season make alfalfa the largest agricultural user of water, with annual water applications of 4,000,000 to 5,500,000 acre-feet.” Per the California Agricultural Production and Irrigated Water Use report published by the Congressional Research Service in 2015, California irrigates over 830,000 acres of pasture.
Relevant Sources
- Johnson, R., & Cody, B. A. (2015). (rep.). California Agricultural Production and Irrigated Water Use (p. 18). Washington, D.C.: Congressional Research Service. Retrieved from https://sgp.fas.org/crs/misc/R44093.pdf.
- University of California Agriculture and Natural Resources. (n.d.). Alfalfa. UC Drought Management. http://ucmanagedrought.ucdavis.edu/Agriculture/Crop_Irrigation_Strategies/Alfalfa/.
[7] California’s Almond Crop Acreage
Per California Department of Food and Agriculture’s 2020 California Almond Objective Measurement Report, in 2020 California’s almond acreage totaled 1.26 million bearing acres.
California has 280 state park units (including state parks, state recreation areas, state historic areas and state beaches) with an approximate area of 1.56 million acres. Of these 280 park units managed by the California Department of Parks and Recreation, 88 are officially designated as “state parks”, with an area of approximately 1.16 million acres. Anza-Borrego Desert State Park, the largest state park in California, is approximately 585,930 acres.
| Area (Acres) | |
| All 280 California State Park Units | 1,566,219 |
| 2020 California Almond Crop Acreage | 1,260,000 |
| California Park Units classified as “State Parks” | 1,162,571 |
| Anza-Borrego Desert State Park (Largest State Park in California) | 585,930 |
Relevant Sources:
- California Department of Food and Agriculture, & USDA’s National Agricultural Statistics Service. (2021). (rep.). 2020 California Almond Objective Measurement Report. California Department of Food and Agriculture. Sacramento, CA. Retrieved from https://www.nass.usda.gov/Statistics_by_State/California/Publications/Specialty_and_Other_Releases/Almond/Objective-Measurement/202007almom.pdf
- California State Parks, S. of C. (n.d.). About us. CA State Parks. https://www.parks.ca.gov/?page_id=91.
[8] California’s Grape Crop Acreage
Per California Department of Food and Agriculture’s Grape Acreage Report, in 2020 California’s grape acreage totaled 895,000 acres. Of these 895,000 acres, “wine-type grape acreage [was] estimated at 620,000 acres.”
Yosemite National Park, one of California’s largest and most famous National Parks, by comparison is only 759,620 acres.
Relevant Sources:
- California Department of Food and Agriculture, & USDA’s National Agricultural Statistics Service. (2021). (rep.). California Grape Acreage Report 2020 Crop. California Department of Food and Agriculture. Sacramento, CA. Retrieved from https://www.nass.usda.gov/Statistics_by_State/California/Publications/Specialty_and_Other_Releases/Grapes/Acreage/2021/2020%20Grape%20Acreage%20Report.pdf.
- National Park Service (NPS). (2020). Park statistics. National Parks Service. https://www.nps.gov/yose/learn/management/statistics.htm.
9. Total Water Usage by Crop
To calculate the total volume of water used by each crop, we simply multiply the average acre feet of water required to cultivate one acre of each crop (Figure 1) by the total area under of that crop under irrigated cultivation (Figure 2).
It is important to note that these figures are gross water use per crop. Net water use – the volume of water consumed by the crop, minus runoff and ground seepage – is often lower than the gross water used.
For reference, Shasta Reservoir is California’s largest man-made lake with a gross pool storage capacity of 4,552,000 acre-feet. The city of Los Angeles with the population of nearly 4 million people used 521,915 acre feet of water in 2018.
Relevant Sources
- Northern California Water Association. (2021). Shasta Reservoir. https://norcalwater.org/efficient-water-management/efficient-water-management-regional-sustainability/water-maps/shasta-reservoir/
- City of Los Angeles. (2021). LADWP Water Supply in Acre Feet. Los Angeles Open Data. https://data.lacity.org/City-Infrastructure-Service-Requests/LADWP-Water-Supply-in-Acre-Feet/qyvz-diiw/data
10. California Cannabis Industry Tax Revenues
It is important to note that this figure does NOT include local taxation revenues which are collected in addition to these taxes.
Relevant Source:
- California Department of Tax and Fee Administration (CDTFA). (2021). Cannabis Tax Revenues. https://www.cdtfa.ca.gov/dataportal/charts.htm?url=CannabisTaxRevenues.
11. Economic Value of Agricultural Commodities in California
According to California Department of Food and Agriculture’s Agricultural Statistics Review 2019-2020 Report, the state’s top-5 valued commodities for the 2019 crop were:
- Dairy Products, Milk — $7.34 billion
- Almonds — $6.09 billion
- Grapes — $5.41 billion
- Cattle and Calves — $3.06 billion
- Strawberries — $2.22 billion
It is important to note that California does NOT consider cannabis an agricultural crop which is why cannabis is not included in this list of top valued agricultural commodities.
Relevant Sources:
- California Department of Food and Agriculture. (2020). (rep.). California Agricultural Statistics Review 2019-2020. California Department of Food and Agriculture. Sacramento, CA. Retrieved from https://www.cdfa.ca.gov/Statistics/PDFs/2020_Ag_Stats_Review.pdf.
- California Department of Food and Agriculture. (2021). California Agricultural Production Statistics, 2019 Crop Year Report. https://www.nps.gov/yose/learn/management/statistics.htm.